For some reason, our monitoring alerted that the service “vsphere-ui” from the vCSA it was having some problems randomly. From the user perspective only we noticed some slowness when navigating within the HTML5 client.
I took a quick view of the VAMI I saw this message from the VMware vSphere Client service:
The server is running low on heap memory (>90% utilized.)
So it was time to solve those random alerts about memory utilization.
Let’s work a bit…
Accessing the vCSA via SSH (using PuTTY):
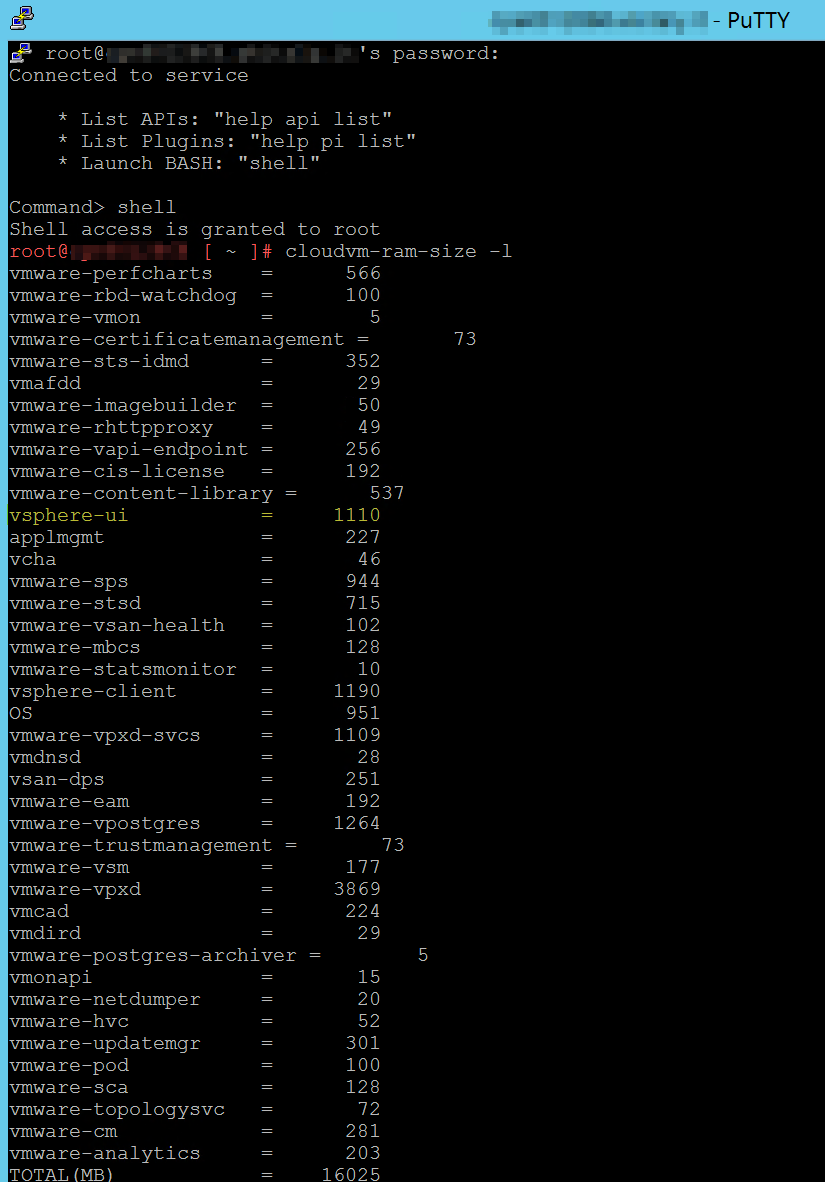
I can see the service has 1110 MB assigned. So as the deployed VM for the vCenter Server appliance has 16GB of RAM allocated(you can see it anyway how much is being assigned in the previous screenshot), I decided to give it ~1.5x (1665MB) but in powers of 2!:
512+1024 = 1536 MB .
Executed:
[powershell]cloudvm-ram-size -C 1536 vsphere-ui [/powershell]
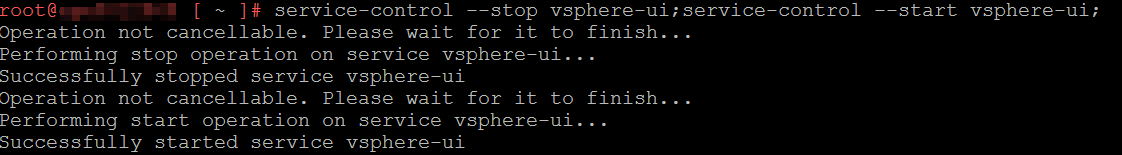
Now, restart the affected service:
[powershell]service-control –stop vsphere-ui;service-control –start vsphere-ui; [/powershell]
And now check the allocated memory for the service we configured:![]()
It seems that the vCSA itself adjusted the value to what it considers it’s best so nothing that we can modify there. So finally this service memory allocation changed from 1110 MB to 1792 MB.
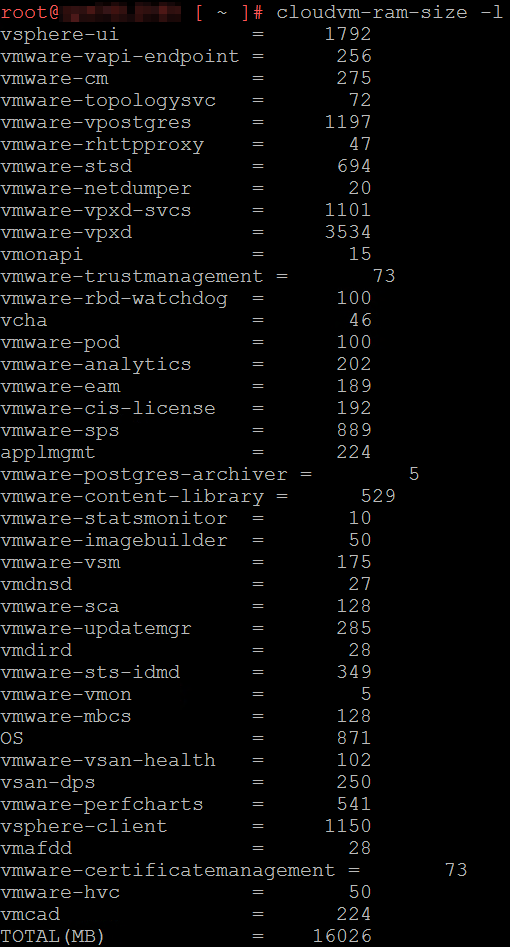
Final note: Obviously other services were modified and have allocated less memory, in general, it gathered a bit of memory allocation from each service (the most impacted was vmware-vpxd with ~ 300 MB)
All this information can be also reviewed in this KB: https://kb.vmware.com/s/article/2150757
That’s all for this quick post!